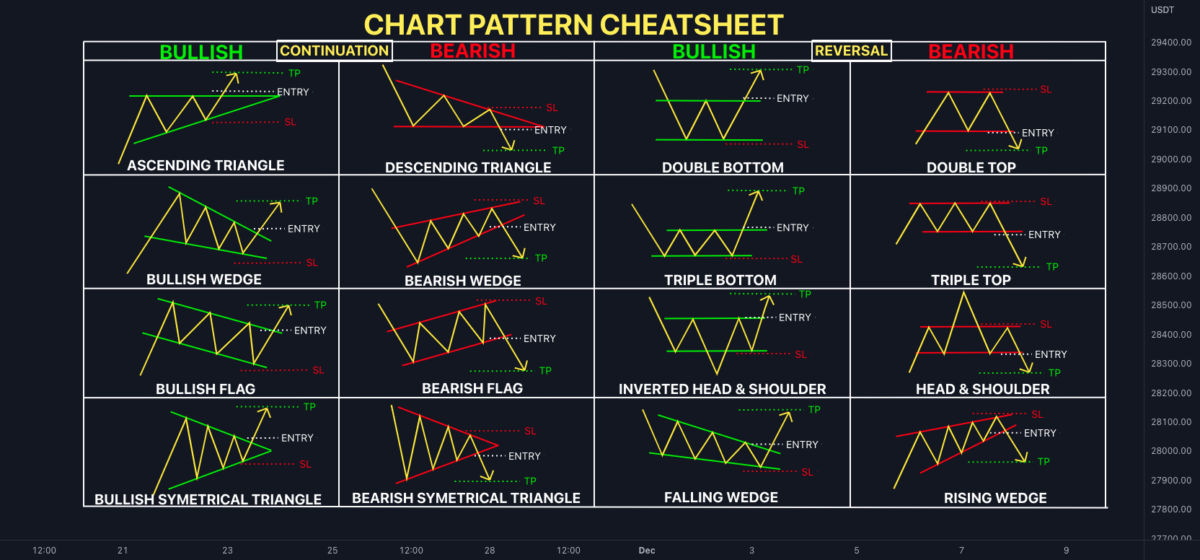
Chart patterns are essential tools for traders seeking to predict future price movements with precision. Understanding these patterns provides a strategic edge, enabling traders to make informed decisions in volatile markets. In this comprehensive guide, we will explore the most powerful chart patterns, their meanings, and how to trade them effectively.
What Are Chart Patterns?
Chart patterns are visual representations of price movements over time, forming distinct shapes on a price chart. These shapes are created by the interaction of supply and demand forces in the market. Traders use chart patterns to anticipate future price movements, identify breakout points, and establish entry and exit strategies.
Chart patterns are categorized into three main types:
- Continuation Patterns: Indicate that the current trend will likely continue.
- Reversal Patterns: Signal a potential change in the market’s trend direction.
- Bilateral Patterns: Indicate indecision in the market, where the price can break out in either direction.
Top Chart Patterns Every Trader Must Know
1. Head and Shoulders (Reversal Pattern)
The Head and Shoulders pattern is one of the most reliable reversal patterns. It signals a shift from a bullish to a bearish trend.
How to Identify It
- Left Shoulder: A price rise followed by a peak and a subsequent decline.
- Head: A higher peak after the left shoulder, followed by another decline.
- Right Shoulder: A smaller rise that forms a lower peak, followed by a decline.
- Neckline: A support level connecting the lows of the two declines.
Trading Strategy
- Entry: When the price breaks below the neckline.
- Stop Loss: Slightly above the right shoulder peak.
- Profit Target: The height from the head to the neckline is projected downward.
2. Inverse Head and Shoulders (Reversal Pattern)
The Inverse Head and Shoulders are the opposite of the standard pattern, signaling a bearish-to-bullish reversal.
How to Identify It
- Left Shoulder: A price decline, then a low, followed by a slight rise.
- Head: A lower low after the left shoulder, followed by a rise.
- Right Shoulder: A smaller low, followed by a higher rise.
- Neckline: A resistance line connecting the highs of the rises.
Trading Strategy
- Entry: When the price breaks above the neckline.
- Stop Loss: Below the right shoulder low.
- Profit Target: The height from the head to the neckline projected upward.
3. Double Top and Double Bottom (Reversal Patterns)
These patterns indicate a potential trend reversal.
Double Top
- Resembles an “M” shape and signals a bullish-to-bearish reversal.
- Occurs when the price forms two consecutive peaks at the same resistance level.
Double Bottom
- Resembles a “W” shape and indicates a bearish-to-bullish reversal.
- Occurs when the price forms two consecutive lows at the same support level.
Trading Strategy
- Entry: After the price breaks below (double top) or above (double bottom) the neckline.
- Stop Loss: Slightly above the peaks (for double top) or below the lows (for double bottom).
- Profit Target: Measure the height from the peak to the neckline and project it downward (double top) or upward (double bottom).
4. Triangles (Continuation Patterns)
Triangles are consolidation patterns that occur before a continuation of the previous trend.
Types of Triangles
- Ascending Triangle: Bullish pattern with a flat resistance line and higher lows.
- Descending Triangle: Bearish pattern with a flat support line and lower highs.
- Symmetrical Triangle: Indicates indecision, where the price can break in either direction.
Trading Strategy
- Entry: Place an order at the breakout point in the direction of the trend.
- Stop Loss: Place below the lower bound of the triangle.
- Profit Target: Measure the height of the triangle and project it from the breakout point.
5. Flags and Pennants (Continuation Patterns)
These are short-term continuation patterns that follow strong price movements.
Flag
- Resembles a small rectangular consolidation after a sharp price move.
Pennant
- Similar to a triangle but smaller and occurs after a steep price move.
Trading Strategy
- Entry: When the price breaks out of the flag or pennant.
- Stop Loss: Below the flag or pennant.
- Profit Target: Measure the length of the flagpole and project it from the breakout.
6. Wedges (Reversal and Continuation Patterns)
Wedges are similar to triangles but have a slanted structure.
Types of Wedges
- Rising Wedge: Bearish pattern, where the price moves upward but at a slowing rate.
- Falling Wedge: Bullish pattern, where price moves downward but at a slowing rate.
Trading Strategy
- Entry: When the price breaks out of the wedge.
- Stop Loss: Below the wedge for the falling wedge; above for the rising wedge.
- Profit Target: Measure the height of the wedge at its widest point and project it from the breakout.
7. Cup and Handle (Continuation Pattern)
This bullish pattern resembles a teacup shape with a handle.
How to Identify It
- Cup: A rounded “U” shape.
- Handle: A small downward consolidation that follows the cup.
Trading Strategy
- Entry: When the price breaks out of the handle’s resistance.
- Stop Loss: Below the handle’s lowest point.
- Profit Target: Measure the height of the cup and project it upward from the breakout.
How to Use Chart Patterns Effectively
To master chart patterns, follow these essential tips:
- Combine with Indicators: Use RSI, MACD, and Moving Averages to confirm breakouts.
- Practice Risk Management: Always set stop-loss orders to minimize risk.
- Look for Volume Confirmation: High trading volume on a breakout confirms its validity.
- Backtest Your Strategies: Analyze past trades and identify which patterns work best for your style.
Common Mistakes When Trading Chart Patterns
- Ignoring Volume: A breakout without volume is a weak signal.
- Forcing Patterns: Not every price movement forms a valid pattern.
- Late Entries: Entering after the price has already moved too far reduces profit potential.
- Lack of Patience: Wait for confirmation before entering a trade.
Conclusion
Mastering chart patterns is a crucial skill for traders aiming to stay ahead of market trends. From Head and Shoulders to Triangles and Wedges, these patterns provide a clear framework for predicting future price movements. Successful traders combine these patterns with technical indicators, volume analysis, and disciplined risk management to achieve consistent results. Start identifying these patterns in live markets and apply the strategies discussed here to elevate your trading game.